Neeraj Karande - Quality Engineer

JMP Predictive Modeling & Statistical Analysis for Quality Improvement
This section showcases data-driven solutions using JMP for real-world industrial challenges. Through statistical modeling, visualization, and neural networks, it highlights how predictive analytics can uncover insights, optimize performance, and enhance decision-making in manufacturing and operations.
Using k-Nearest Neighbours
🔢📍
Using Generalised Regression
📉🧮
Using Naive Bayes
📊➗
Using Bootstrap Forest and Boosted Trees
🌲📦
Using Support Vector Machines
🧱📈
Using Neural Networks
🧠🔗
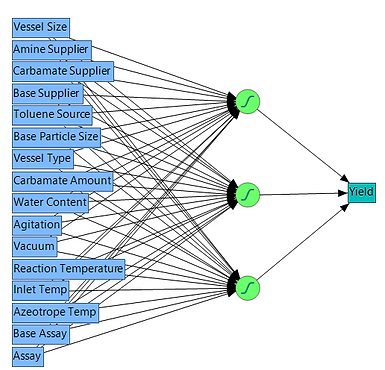
This model illustrates a neural network trained on multiple process inputs to predict product yield. Key variables like temperature, agitation, and supplier types influence intermediate layers, culminating in yield prediction. It demonstrates advanced modeling using JMP to optimize complex manufacturing processes.
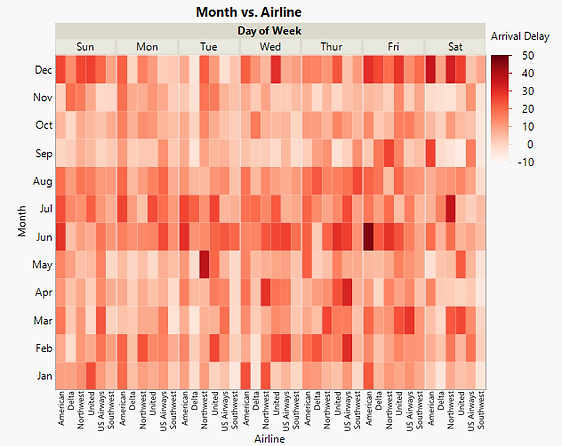
This heatmap visualizes the average flight arrival delays across different airlines by month and day of the week. Darker shades indicate greater delays, helping uncover seasonal patterns and weekly trends in airline performance. It supports data-driven decisions for improving scheduling and passenger experience.

Driving Quality Excellence Through Data-Driven Decision Making
This portfolio exemplifies how JMP’s statistical and predictive modeling capabilities support Quality Analytics in line with structured methodologies like FMEA (Failure Mode and Effects Analysis) and Root Cause Analysis (RCA). By identifying variation sources and visualizing key relationships between process inputs and outcomes, these analyses align with ISO 9001 and other quality management system standards that emphasize evidence-based decision-making and continual improvement.
Using 8D (Eight Disciplines Problem Solving) principles, the dashboards and visualizations shown here enable data-driven containment, corrective actions, and preventive strategies. Interactive heatmaps, neural network models, and multivariate analyses not only enhance visibility into patterns and trends but also empower cross-functional teams to collaborate with clarity. Ultimately, this approach transforms raw process data into actionable insights that drive product consistency, process capability, and long-term customer satisfaction.